Elections
Election data covering 11 federal elections and a referendum in Russia, including number of voters, number of voting participants, results for each candidate, and share of anomalous votes.
Browse data
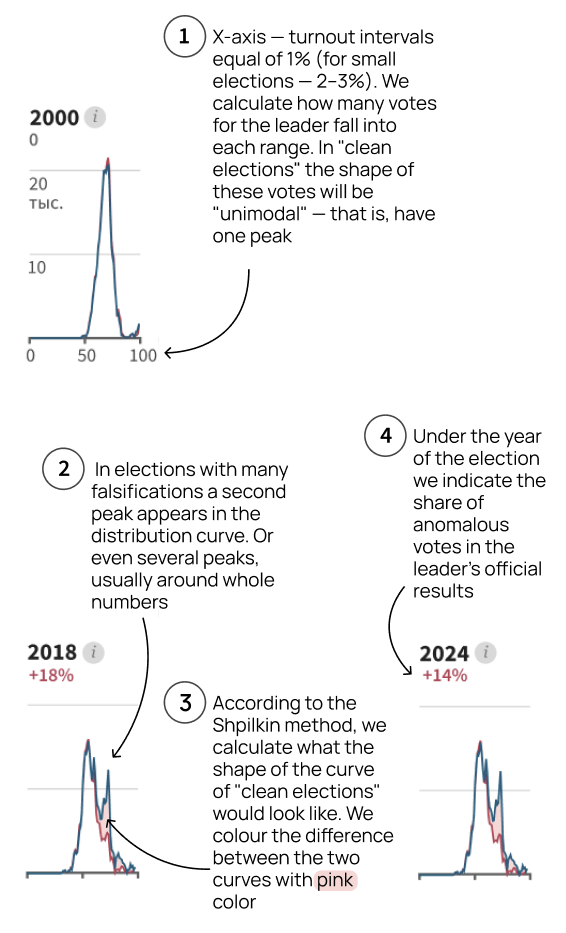
With this interactive tool you can explore the election results and the scope of electoral fraud in all Russian regions since 2000. For each election, the proportion of anomalous votes out of all votes cast for the winning candidate is indicated. For the full methodology read our report below.
For each election, the proportion of anomalous votes out of all votes cast for the leader is indicated
2000
2003
2004
2007
2008
2011
2012
2016
2018
2020
2021
2024
Central Election Commission of Russia. On the X-axis are the turnout intervals, and on the Y-axis is the number of votes for the leader in the corresponding range. For 2024, the data does not include electronic voting and occupied territories. Read more by clicking the "How to read this graph" button in the upper right corner.
Related research

How to uncover electoral fraud in Russia using statistics: a complete guide
Vladimir Putin won the presidential election for the fifth time, receiving a record 87% of the votes in the history of modern Russia, with an equally record turnout of 77%. With it comes a record level of falsifications. Cedar’s team has studied the detailed results of 12 federal elections during Putin's reign and documented various types of violations using electoral statistics methods. This is how Russian elections transformed from being relatively fair to a complete imitation of the voting process.
Read the report